What a trade actually costs in a simulation
Your backtest charged you something to trade. Here is what it was, and what changes when you set a commission.
You ran a backtest and got a number. Before you trust it, ask one question: what did the run charge you to trade?
On CodeBull the answer is short. By default, a run pays the market maker's spread and nothing else. Commission is a rate you choose for each run, and it starts at 0. This post runs one strategy twice, once with commission at 0 and once at 10 bps, and puts the two reports side by side.
What a run charges
Two costs can apply to a trade in a simulation.
The spread. The synthetic market maker is on in every run unless you switch it off, and by default it quotes a 20 bps spread: a price to buy just above the bar's price, and a price to sell just below it. A market order crosses it and pays roughly 10 bps a side. Limit vs market order explains how a spread works.
Commission. A field on the Simulation page, under Advanced: Commission (basis points). It is charged per side on each fill's value, so a round trip pays it twice. The form's own hint puts it plainly: "10 = 0.1% per trade, paid on entry and again on exit." It starts at 0, so a run charges no commission until you set one.
That is the whole list. A simulation models the market maker's spread, but no exchange fees, no borrow cost and no market impact. We come back to that at the end.
The experiment
The strategy is the Mean Reversion (Intermediate) template, on the symbols and interval it recommends: SPY and QQQ, hourly bars. It holds positions of 5 shares. It buys when the price drops well below its 20-bar average and sells when it rises well above it, going short if it holds nothing. If the signal reverses while it holds a position, it flips: from long 5 to short 5 in one 10-share order, and back the same way. When the price comes back near the average, it places the opposite order to close the position.
The run covers 28 July to 25 September 2026, starts with a simulated $10,000, and keeps the market maker on at its 20 bps spread. It ran on a Free account. Every fill in this window was 5 shares, so the strategy never flipped: each position it closed, it closed when the price came back near the average.
We ran it twice and changed one field: Commission, first 0, then 10.
The fills were identical in both runs: the same 41 fills, at the same times and the same prices. So every difference between the two reports is commission, and nothing else.
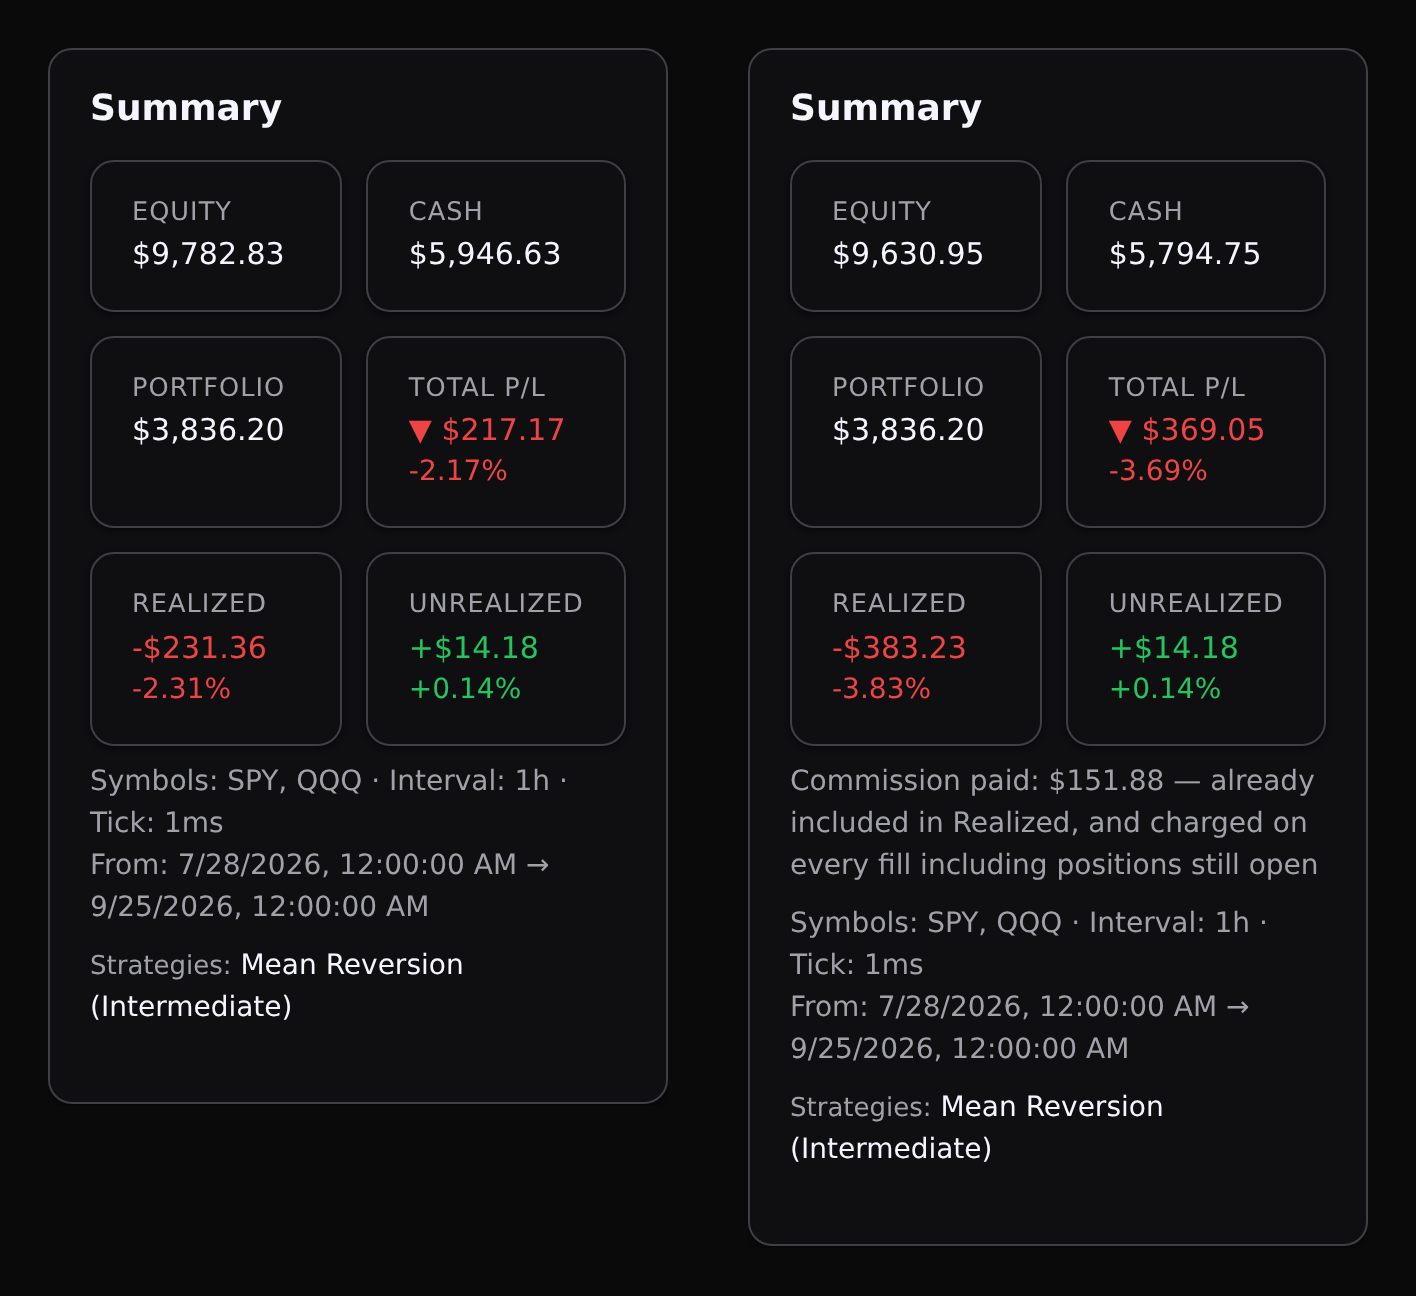
Left: commission 0. Right: commission 10 bps. Same strategy, symbols, dates and fills. Simulated money.
| Commission 0 | Commission 10 bps | |
|---|---|---|
| Commission paid | — | $151.88 |
| Equity at the end | $9,782.83 | $9,630.95 |
| Realized | −$231.36 | −$383.23 |
| Return | −2.17% | −3.69% |
| Sharpe | −2.61 | −4.47 |
| Max drawdown | 3.11% | 4.44% |
| vs Buy & Hold | −9.90% | −11.42% |
| Buy & Hold | +7.73% | +7.73% |
Buy & Hold stays at +7.73% in both columns because the report's Buy & Hold pays no commission, so at 10 bps a small part of the wider gap is the setup, not the strategy.
Where the $151.88 comes from
Mean Reversion traded $151,875 worth of SPY and QQQ: 41 fills of 5 shares each. 10 bps of that is $151.88, to the cent. That is 15 times its starting balance, traded in under two months.
The report puts it in the Summary, in its own words: "Commission paid: $151.88 — already included in Realized, and charged on every fill including positions still open." Equity is lower by exactly that amount.
The cost that was already there
Now look at the first run again. It charged no commission, but it still paid to trade. Each of its 41 fills landed 0.10% from the bar's closing price, above it to buy and below it to sell. That is half of the market maker's 20 bps spread, paid on every fill. On $151,875 of trading, it comes to about $152.
So at the settings you get without touching anything, this backtest already paid about as much in spread as a 10 bps commission costs. The run at 0 was never free to trade. Setting commission to 10 doubled what it was already paying.
The same rate on a strategy that barely trades
For contrast, the Diamond Hands (Buy & Hold) template, on the stocks it recommends (AAPL, MSFT, GOOGL and NVDA, daily bars), over the same window with the same settings. It buys once and holds: 4 fills, all on the first day.
| Commission 0 | Commission 10 bps | |
|---|---|---|
| Fills | 4 | 4 |
| Commission paid | — | $9.88 |
| Return | +13.28% | +13.18% |
The rate was the same. Mean Reversion paid about 15 times as much because it traded about 15 times as much. Commission is charged on what you trade, not on what you hold, so the strategy that trades most is the one a run at 0 flatters most.
The $9.88 also sizes the Buy & Hold point above: a buy-and-hold that does pay 10 bps lost 0.10 points of return to it in this window.
Neither run says which strategy is better. Two months of one market is a single sample, and what a backtest can tell you covers why that matters.
What commission does not change in the report
The report's Per trade figures were the same in both Mean Reversion runs: a win rate of 45%, a profit factor of 0.36 and an expectancy of −$11.57. They are measured from each round trip's entry and exit prices, before commission. Commission shows up in Equity, Realized, Return and the figures that follow from them, such as Sharpe and Max drawdown. When you compare two runs with different commission, compare those.
What 10 bps still leaves out
10 bps is not a claim about what any broker charges. It is a rate you choose, and even with it set, the run leaves costs out: it models the spread, but no exchange fees, no borrow cost and no market impact.
Mean Reversion went short in 10 of its 20 round trips. A real short pays to borrow the shares for as long as it is open. This run charged nothing for that, at 0 or at 10.
Those missing costs can only take more away. If a strategy's edge is gone at 10 bps, they will not bring it back.
Try it
Re-run your last backtest with commission set to 10 bps. It works on Free: every run in this post was made on a Free account.
- Open Simulation and set up the run exactly as before: the same strategy, symbols, interval and dates.
- Open Advanced and set Commission (basis points) to
10. Leave the market maker as it was, so commission is the only thing you change. - Click Start simulation. When it finishes, its report appears under Your reports, next to the old one.
- Open both. The new one shows Commission paid in its Summary, and the difference between the two is what your first run left out.
This article describes how a simulation charges for trades. It is not a recommendation to buy or sell anything, and a cost setting is not a forecast of real results.
Educational content, not financial advice. Backtest results on CodeBull are produced on simulated money and do not predict real returns. No real-money trading takes place on this platform.